HOW
TO INTERPRET THE ETDPROG.EXE
EARTHQUAKE FORECASTING PROGRAM'S
CHARTS, MAPS, AND REPORTS
Latest Update: June 7, 2010
Etdprog.zip.1.B.3.2009/03/05 - EarthWaves Site
is presently available for downloads.
This Interpret.html Web page contains information regarding
how to interpret the
Chart, Maps, and Reports that the Etdprog.exe earthquake
and tornado data
evaluation computer program generates, and make a determination regarding
where an
earthquake might be about to occur.
The EQ Forecasting Freewebz Web Site
The Latest Earthquake Forecasting Data Earthquake Forecasting Resources The Meteoquake Web Site
The Purpose Of The Etdprog.Exe Earthquake Forecasting Computer Program
How To Interpret The Charts, Maps, And Reports
Prepare Lists Of Local Significant Earthquakes
Check The Maps For The Locations Of Plus Signs (+)
Match Em Signal Chart Lines With Past Destructive Earthquakes
Match Em Signal Chart Lines With Your Local Significant Earthquakes
Matching Groups of EM Signal Chart Lines With Earthquakes
Tectonic Plate “Pry Bar” Effects
Watch For The Appearance Of Peaks On The Multiple Groups Of Averaged Em Signals Charts
Using A Variation Of The Multiple Groups Of Averaged Em Signals Charts
Wave Charts And Earthquake Aftershocks
THE PURPOSE OF THE
ETDPROG.EXE
EARTHQUAKE FORECASTING COMPUTER PROGRAM
Charts, Maps, and Reports generated by the Etdprog.exe earthquake forecasting computer program point to locations around the world where significant seismic activity could be about to occur. Governments, earthquake researchers, and disaster mitigation personnel are encouraged to check those areas for earthquake precursors and statistics types of indicators that suggest that seismic activity could be approaching.
When strong indicators of a possible approaching earthquake are observed, government and disaster mitigation personnel are encouraged to take appropriate measures to prepare for it.
Earthquake precursors would be things such as Earthquake Clouds, unusually high levels of static noise on local television and radio transmissions, abrupt changes in ground and well water levels, electromagnetic energy field fluctuations (EM Signals) detected in the atmosphere, in the ground, in ground water, on electric power lines or in metal water pipes, thermal anomalies, gravitational anomalies, high levels of argon gas, low magnitude earthquakes in the area, reports of unusual behavior by pet, farm, zoo, and wild animals in the area, and large numbers of people reporting headaches, nausea, dizziness, aches and pains, and other medical problems.
The following Web page lists a number of earthquake precursors:
http://www.meteoquake.org/bali.html
Statistics types of indicators would be things such as historical records that indicate that a strong earthquake frequently occurs in some area a certain length of time after an earlier strong earthquake has occurred there, probability equations that indicate that an earthquake is likely to occur in some area at a certain time based on earthquakes that have been occurring there and elsewhere, and probability equations that indicate that earthquakes tend to occur in some area when tidal forces and other types of forces are especially strong.
Data generated by the Etdprog.exe program can be used as a secondary, confirming type of data to support forecasting data generated using other forecasting methods such as ones discussed on the Earthquake Forecasting Resources Web page and at the Meteoquake Web site. Etdprog.exe data can also be used as a primary source of data by people who do not have access to any other types of forecast data.
All that are needed to run the downloadable freeware Etdprog.exe computer program are standard, inexpensive PC type computers running Windows Vista, XP, 2000, and NT, and access to lists of EM Signal times. Access to the Internet is also helpful for free updates for the computer program and for access to lists of EM Signal times.
HOW TO INTERPRET THE CHARTS, MAPS, AND REPORTS
READ OVER AND BECOME AS FAMILIAR
AS POSSIBLE
WITH THE INFORMATION DISCUSSED ON THE
ETDPROG.HTML
AND README.HTML WEB PAGES
Those Web pages explain how the Etdprog.exe program works and what its different options are for.
PREPARE LISTS OF LOCAL SIGNIFICANT EARTHQUAKES
Some of the Chart interpretation procedures discussed on this Web page involve comparing EM Signal Chart lines with earthquake related Chart lines. Researchers and government officials should prepare lists of significant earthquakes that occurred anywhere along longitude lines that pass through their areas of interest. That would include significant earthquakes that occurred far to the north or to the south of those areas. This is important because the Etdprog.exe computer program probability equations process earthquake longitude data. And as a consequence, an expected earthquake can occur anywhere along the longitude line of an earthquake that the program points to. Earthquake latitude data are only used when plus signs (+) are displayed on Maps.
Lists of significant earthquakes that occurred over the years can be found on the following Internet Web page. Other lists can be located by doing Internet searches.
http://earthquake.usgs.gov/eqcenter/eqarchives/
CHECK THE MAPS FOR THE LOCATIONS OF PLUS SIGNS (+)
The Etdprog.exe computer program draws plus signs (+) at locations where 50 nondestructive and 50 destructive earthquakes occurred that it determined were the best matches for the EM Signal or group of averaged EM Signals associated with a given map. (Program users can specify how many earthquakes in each group the program should display.)
Government officials and earthquake researchers living or working in areas where large numbers of plus signs are displayed on a map that is for an EM Signal with a strength between 4em and 9em should consider making an effort to determine if there are any earthquake precursors pointing to that area. 1em is the lowest strength EM Signal. 9em is the highest.
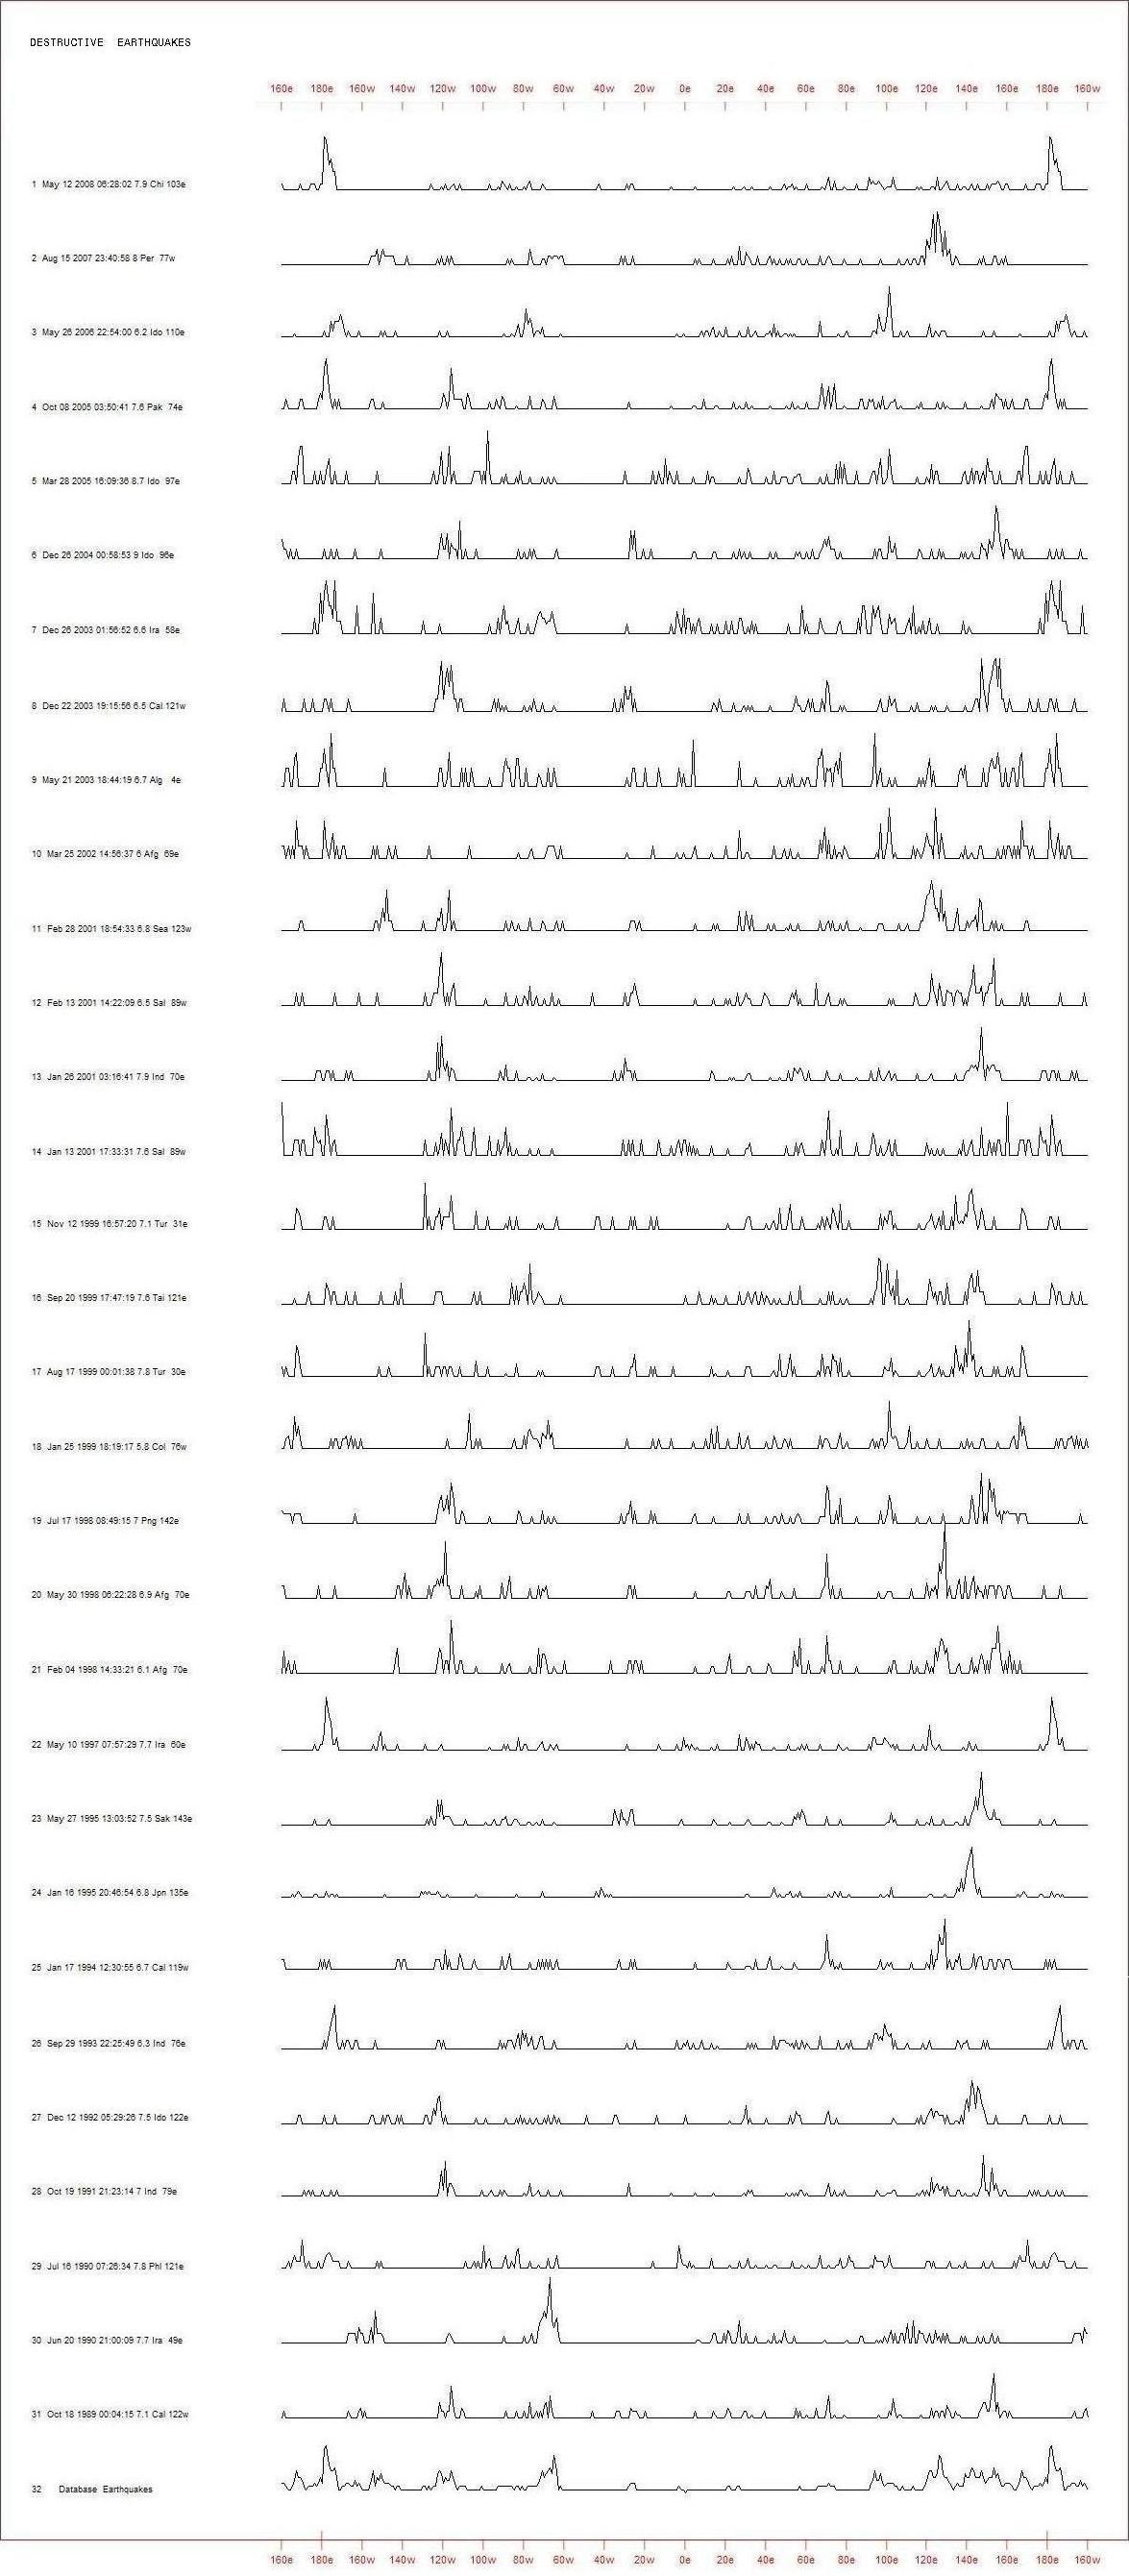
MATCH EM SIGNAL CHART LINES WITH PAST DESTRUCTIVE EARTHQUAKES
EM Signal related Chart lines can be compared with Chart lines for quite a few destructive earthquakes that can be seen on the Destructive Earthquakes Chart. When there is a good match between the EM Signal or group of averaged EM Signals and one of those Destructive Earthquake Chart lines it can serve as an indicator that additional research should be done to see if another earthquake could be about to occur near where the destructive one occurred. Chart line data for destructive earthquakes for use with the Etdprog.exe program is also available in the Datatest.dat file.
MATCH EM SIGNAL CHART LINES WITH YOUR LOCAL SIGNIFICANT EARTHQUAKES
EM Signal related Chart lines can be compared with Chart lines for significant earthquakes that occurred somewhere along longitude lines that pass through your areas of interest. That includes earthquakes that occurred far to the north and to the south of your location. When there is a good match between the EM Signal or group of averaged EM Signals and one of those Chart lines it can serve as an indicator that additional research should be done to see if another earthquake could be about to occur somewhere along the longitude line of that significant earthquake.
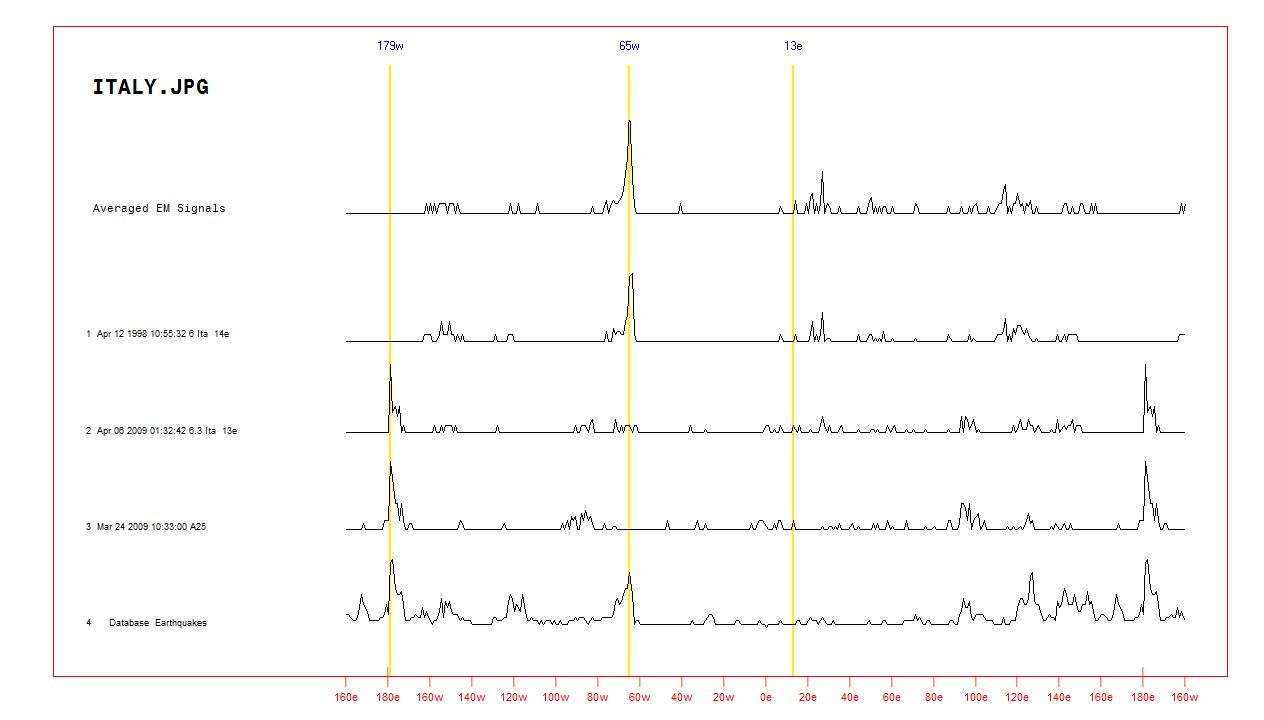
For example, as the following chart show, based on EM Signals detected in March of 2009 the Etdprog.exe computer program indicated that the following earthquake was a good match for the signals.
1998/04/12 10:55:32 46.24N 13.60E 10.0 6.0
The destructive April 6, 2009 earthquake in Italy occurred several weeks later along that same longitude line.
2009/04/06 01:32:39 42.33N 13.33E 9 6.3 Central Italy
Unless your local significant earthquakes are already displayed on the Destructive Earthquakes Chart you would need to generate new Charts, Maps, and Reports for them by finding the appropriate earthquake data line in the Dataeqem.dat file in the Etdprog.zip package or in the Etdprog.exe program’s Forecast\ directory, copying it to the Datatest.dat file, and then running the Etdprog.exe program with the Chart/Map/Report option.
Or, the earthquake time itself can be processed by the Etdprog.exe program using the Process Times option. And the data line that is generated can be displayed with the “b” option and then copied to the Datatest.dat file. The Process Times option presently generates EM Signal data lines. Some minor changes are then needed to convert the EM Signal lines to Datatest.dat file type earthquake lines.
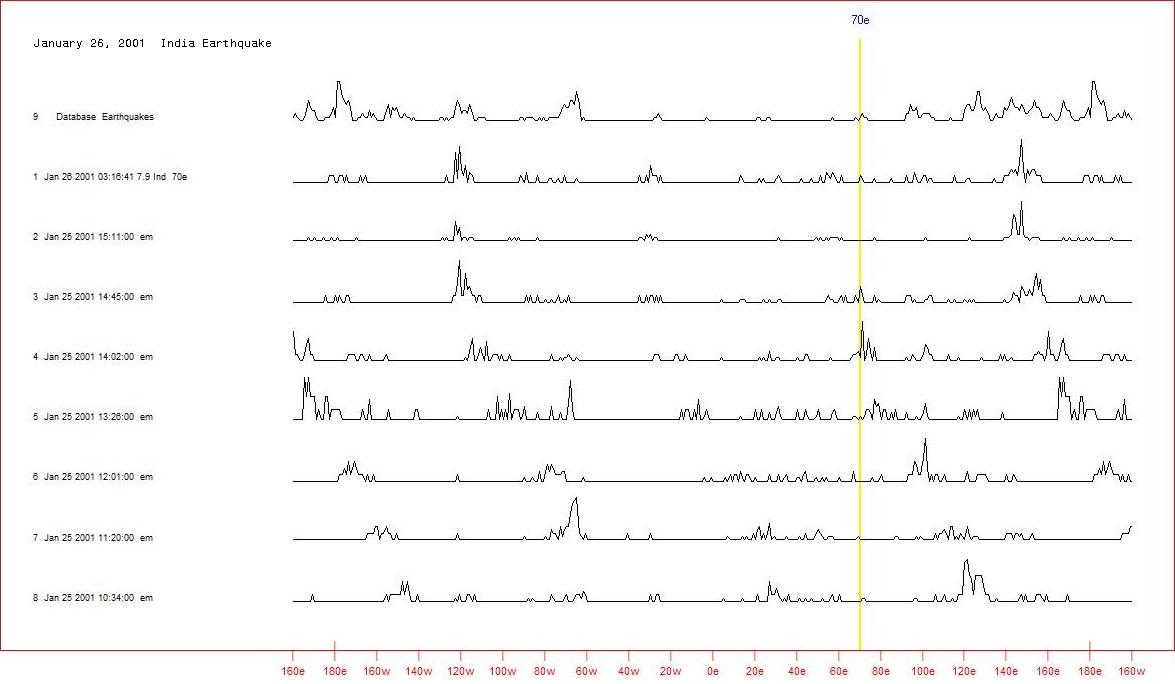
MATCHING GROUPS OF EM SIGNAL CHART LINES WITH EARTHQUAKES
Quite often, two to as many as eight EM Signals will be detected during a twelve hour period of time. What is responsible for multiple EM Signals being generated during a relatively short period of time like that is not known. However, it is presently believed that there might be some type of link between volcanic activity, earthquake fault zone activity, and the Earth’s geomagnetic energy field. And whatever that link is, it results in multiple signals being generated like that.
As the following Chart shows, the final EM Signal or the last two EM Signals in a group of signals will often be a good match for an expected earthquake. And they are usually the most important signals to evaluate in a group of signals.
COMPARE DATATEST.DAT AND
DATAEQEM.DAT FILE GRAVITY POINT GLON,
MOON MLON, AND
EARTHQUAKE ELON, EARTHQUAKE
DATA FINGERPRINT
NUMBERS WITH ONE ANOTHER
The following is a sophisticated and powerful procedure for using Etdprog.exe program data to determine where an expected earthquake might be about to occur. EM Signals detected during March of 2009 are being used for an example. Those signals appear to have been clearly pointing to Alaskan Redoubt volcano activity (around 155 W longitude) that was occurring at that time rather than to an earthquake.
The next section of this report having to do with Tectonic Plate “Pry Bar” Effects should also be read for a better understanding of the information in this section.
EM Signal and earthquake times are fed into the Etdprog.exe program. And it uses the SunGP.exe computer program included in the Etdprog.zip package and stored in the Etdprog Forecast\ directory in order to generate Subsolar, Sublunar, and Gravity Point latitude and longitude data for those times.
The resultant longitudes and earthquake longitudes have 90, 180, or 270 longitude degrees added to them or subtracted from them so that they fall into the 0 to 89 longitude degree range.
Gravity Point related values are referred to as Glon numbers in the Etdprog.exe program’s Datatest.dat and Dataeqem.dat files. Sublunar related values are referred to as Mlon numbers. And earthquake longitude related values are referred to as Elon numbers.
Three Glon, Mlon, and Elon number comparison techniques can be used to match those numbers with one another and at times determine the location of an expected earthquake.
1. EM Signal Glon and Mlon numbers will often match the Elon numbers of earthquakes that occurred around the same longitude as the longitude where the expected earthquake could be about to occur.
2. If the Glon number for an EM Signal is compared with the Mlon number for another EM Signal detected within a few hours or a few days after the first EM Signal then those two numbers will at times be fairly close to one another. And that number will match the Elon number of an earthquake that occurred at the same longitude as the longitude of the expected earthquake.
3. Using the opposite comparison procedure, if the Mlon number for an EM Signal is compared with the Glon number for another EM Signal detected within a few hours or a few days after the first EM Signal then those two numbers will at times be fairly close to one another. And that number will match the Elon number of an earthquake that occurred at the same longitude as the longitude of the expected earthquake.
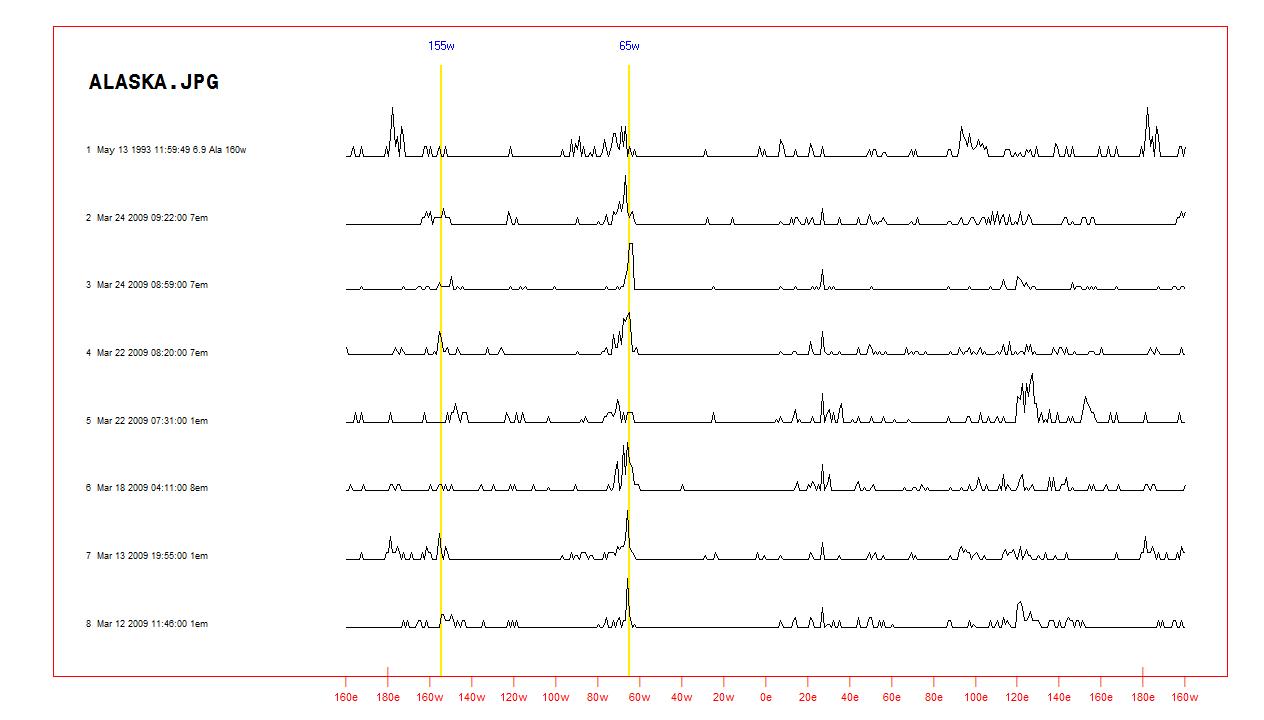
Comparison procedure 1 can be used with the following example. Glon and Mlon numbers having values in the 68 to 70 range are present with all of the EM Signals. And the powerful 1993/05/13 Alaska area earthquake occurred at 160 W longitude. 160 – 90 would produce an Elon value of 70, about the same as the Glon and Mlon numbers. The Alaska Redoubt volcano is located roughly around the 155 W longitude area.
Comparison procedure 2 can also be used with this example. Several cases are shown where Glon and Mlon numbers for EM Signals occurring within a day of one another have matching values in the 68 to 70 range. And they match the Elon value of the earthquake.
str wcode qcode type ang elon glon mlon chr la sa date time
,
, , q , -90 ,
70 , 67
, 88 , 79 , 36 , 86 , 1993/05/13 , 11:59:49
1993/05/13 11:59:49 55.18N 160.40W 32.0 6.9 Alaska Peninsula Area
(U.S. National Earthquake Information Service data)
7
, 7em , , w , -26 , ,
68 , 75 , 35 , 22 , 67 , 2009/03/24 , 09:22:00
7 , 7em , , w , -26 , ,
62 , 70 , 29 , 16 , 61 , 2009/03/24 , 08:59:00
7
, 7em , , w , -48 , ,
68 , 82 , 40 , 20 , 66 , 2009/03/22 , 08:20:00
1 , 1em , , w , -49 , ,
56 , 70 , 28 , 8 , 54 , 2009/03/22 , 07:31:00
8 , 8em , , w , -97 , , 43 , 68 , 65 , 24 , 82 , 2009/03/18 , 04:11:00
1
, 1em , , w , -150 , , 69 ,
87 , 64 , 51 , 87 , 2009/03/13 , 19:55:00
1 , 1em , , w , -165 , , 60 ,
70 , 43 , 30 , 76 , 2009/03/12 , 11:46:00
The following chart displays those data.
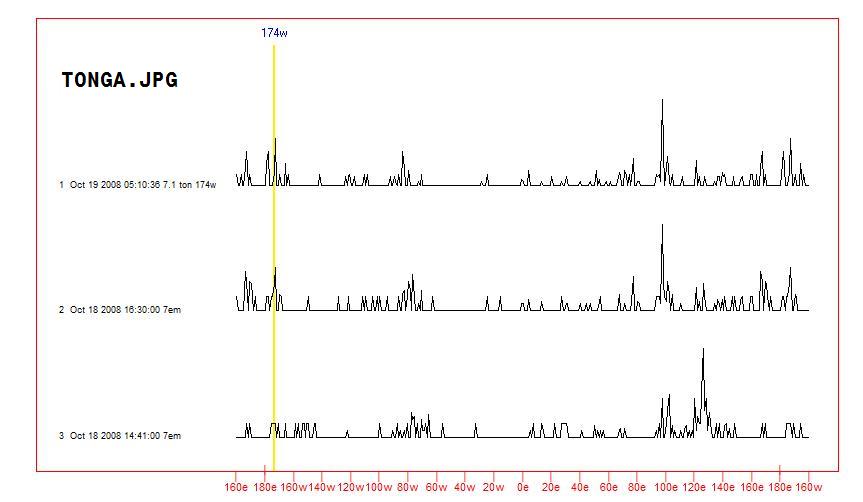
The second example below pertains to the powerful October 19, 2008 Tonga area earthquake and two EM Signals that were detected on October 18. The EM Signal Glon and Mlon 82 values are good matches for the earthquake’s Elon 84 value. Note also that the earthquake has a Glon 84 value.
str wcode qcode type ang elon glon mlon chr la sa date time
,
, Ton , q , -120 , 84 , 84 , 20 , 15
, 79 , 37 , 2008/10/19 , 05:10:36
2008/10/19 05:10:36 21.75S 173.91W 42.0 7.1 Tonga
(U.S. National Earthquake Information Service data)
7 , 7em
, , w , -127 , , 82
, 18 , 10 , 77 , 34 , 2008/10/18 , 16:30:00
7 , 7em , , w , -128 , , 57
, 82 , 73 , 51 , 8 , 2008/10/18
, 14:41:00
The following chart displays those data.
The following is a proposed explanation for what is taking place with those three comparison procedures.
As shown on the above drawing, Mlon is associated with the longitude of the Sublunar Point, the location on the surface of the Earth that the moon is directly above at any given time. Glon is associated with the longitude of the Gravity Point. It is the location on the surface of the Earth where the combined gravitational pulls of the sun and the moon are strongest if the factor 2.5 is used for the moon/sun gravity strength ratio.
When the Glon value is the same as an earthquake's Elon value it means that the Gravity Point is at a high probability location for earthquake triggering to occur. The same is true for when the Mlon value is the same as an earthquake's Elon value. But the probability of earthquake triggering taking place at that time is not as high.
At those Mlon and Glon related Elon matching times an EM Signal can be generated if the earthquake does not actually occur. And those two times can be a few minutes to a few hours apart on the same day, or a few minutes or hours apart relative to one another, but on different days.
What happens is that the Mlon related point will match the Elon value and an EM Signal will be generated. A few hours later the Glon related point will match the Elon value and another EM Signal will be generated. Or, if the Glon point is to the west of the Mlon point the opposite sequence of events will occur. Because the Mlon and Glon values are the same as one another that information can at times be used to determine the Elon value of the expected earthquake. And the earthquake’s actual longitude will be that Mlon and Glon longitude, or a longitude 90, 180, or 270 longitude degrees to the east or west of that longitude.
Those types of comparison procedures can also be used with Datatest.dat and Dataeqem.dat file Chr, La, and Sa numbers. But the probability that a helpful match will be observed is lower. The Etdprog.exe program probability equations use matches involving those numbers. But the matches are given lower weight values that reflect their lower probabilities.
TECTONIC PLATE “PRY BAR” EFFECTS
The Etdprog.exe earthquake forecasting computer program probability equations presently being used to match EM Signals with earthquake fault zone activities and earthquakes with other earthquakes probably work best for fault zones where sun and moon gravity related forces trigger earthquakes in roughly the same manner all the time. However, present theories propose that this might not be the situation for locations such as the Central America area and the Japan area where the fault zone structure can be fairly complex. And this might not be the situation where earthquakes are occurring in fault zones on one side or the other of relatively small tectonic plates.
Present theories propose that in some of those cases, the sun and moon gravity related forces are exerting pressure on one side of a relatively small tectonic plate for example, and some of the pressure is being transferred to the other side of the plate where a fault zone is about ready to fracture. The earthquake then occurs at that location. The small tectonic plate is to a certain extent acting like a “pry bar.” The Etdprog.exe computer program equations point to the side of the tectonic plate where the pressure is being applied. But the expected earthquake occurs some distance away on the other side.
For example, the following EM Signals were detected during May of 2009. They might have been pointing to the approach of the moderately destructive earthquake that occurred in the Honduras area on May 28, 2009.
2009/05/28 08:24:46 16.73N
86.20W 10 7.3 Offshore Honduras
(U.S. National Earthquake
Information Service data)
str wcode qcode type ang elon glon mlon chr la sa date time
6 , em6 , , w , -46 , ,
74 , 86 , 54 , 32 , 76 , 2009/05/21 , 02:38:00
6 , em6 , , w , -47 , , 60 ,
72 , 40 , 18 , 62 , 2009/05/21 , 01:39:00
Using the data processing procedure discussed in the above section, those data suggested that the earthquake might occur at around 73 W. And it actually occurred at 86 W. The theories in this section of this report propose that sun and moon gravity force related pressure might have been exerted on the Caribbean tectonic plate at around 73 W. And some of the pressure was transferred to the west causing the earthquake to occur at 86 W.
If that theory is correct then more sophisticated probability equations might be developed to correct for those tectonic plate “pry bar” type effects.
WATCH FOR THE APPEARANCE OF PEAKS
ON THE
MULTIPLE GROUPS OF AVERAGED EM SIGNALS CHARTS
The Multiple Groups Of Averaged EM Signals Charts option forecasting mode has been temporarily disabled in the present download version of the Etdprog.exe program in part because it runs by processing very large numbers of EM Signals. And only a relatively small number of EM Signals are presently available at this Web site at a given time. However, since this mode is the normal way of doing earthquake forecasting work using the Etdprog.exe program, it is being discussed here.
The other Chart, Map, and Report data evaluation procedures being discussed here involve running the program in its “Research” mode. And it works quite well as an earthquake forecasting program in that mode. But the data might not be as accurate as those generated when the program is running in its normal forecasting mode. And they are more difficult to interpret.
The following Chart displays the type of data that the program generates when it is running in its normal forecasting mode.
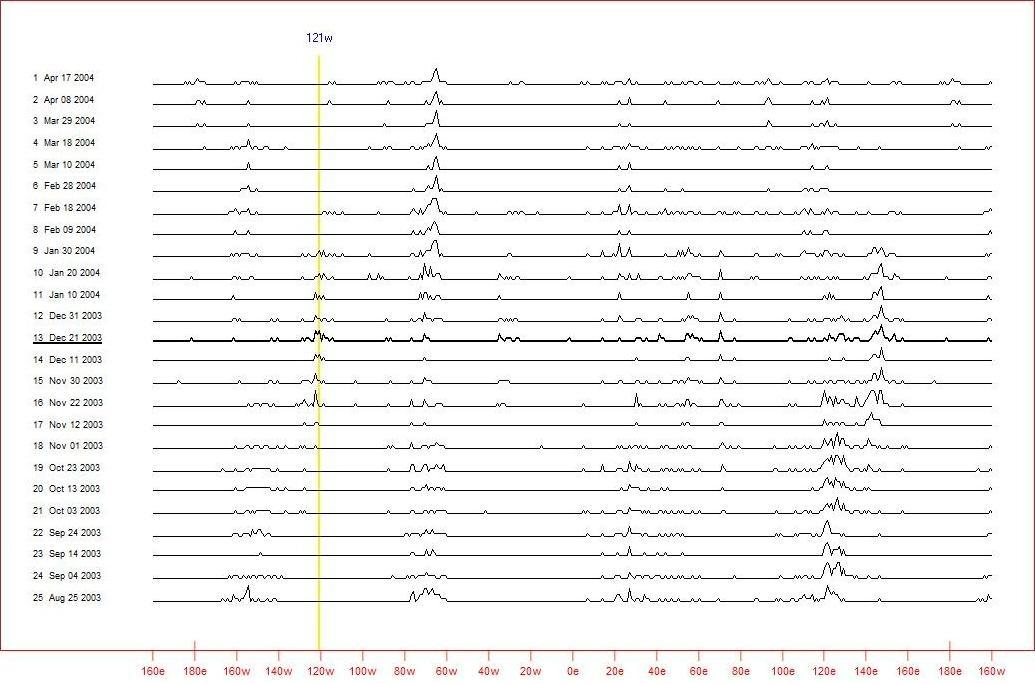
Each line represents about three months’ worth of EM Signals averaged together and processed as though they were a single EM Signal. Any two adjacent lines on the Chart are offset from one another by about ten days. As a result, they involve many of the same EM Signals.
The lengthy time windows are used in order to average or smooth away as much as possible of the normal randomness associated with individual EM Signals.
At about 122 W on that Chart a peak is starting to appear around the beginning of November, following an extremly intense solar storm. And that Chart peak might have been an indicator that a destructive earthquake was going to occur at that longitude. In fact one did occur in at that longitude in California on December 22, 2003.
If the Chart lines were amplified a peak could also be observed starting to appear around that time at 58 E. And on December 26, 2003 a tremendously destructive earthquake occurred in Bam, Iran, at 58 E.
When government and disaster mitigation personnel and earthquake forecasters see Chart peaks like those starting to appear at a longitude of interest to them, or at a longitude 90, 180, or 270 degrees to the east or west of that longitude then they should start checking for signs that an earthquake could be approaching in that area.
If the # 4 keyboard key is pressed when the Etdprog.exe program is running and displaying Charts or Maps, four or five vertical yellow longitude lines will display. Those lines are 90 longitude degrees apart. And they make it easy to tell what those alternate longitudes are.
USING A VARIATION OF THE MULTIPLE GROUPS OF AVERAGED EM SIGNALS CHARTS
Although it has been temporarily disabled, the Etdprog.exe program can run a very powerful variation of the Multiple Groups Of Averaged EM Signals option. It will be discussed in more detail in future versions of this Interpret.html Web page.
Basically, it enables the program user to choose a group of earthquakes and observe changes over time in how strongly each of the Averaged EM Signal groups points to the individual earthquakes in that group. Program users in different parts of the world can select significant earthquakes that occurred in the past in their areas and then observe those changes for those earthquakes. When the program is running in its normal Multiple Groups Of Averaged EM Signals mode those significant earthquakes might not display because they are not in the group of top 50 nondestructive or 50 destructive earthquakes that match a given group of EM Signals.
WAVE CHARTS AND EARTHQUAKE AFTERSHOCKS
For centuries probably, earthquake researchers have argued with one another about the subject of how earthquakes are being triggered. Some researchers insist that they are random events. Others believe that they are triggered directly by lunar or solar gravitational forces or both, indirectly by those forces acting through the Tide Generating Force, by forces associated with the slightly different momentary rotational speeds and direction of the Earth’s crust and it core, by fault zone heating associated with intense solar storms, or by any number of other factors or forces.
A list of possible triggering forces etc. can be found on the Earthquake Triggering Processes Web page. The Wave Charts attempt to show how the strengths of a number of those forces change with time. They enable researchers to gain some insight into what forces might have been responsible for the triggering of a given earthquake.
The Wave Charts can also be extremely valuable for determining when an aftershock for a powerful earthquake is likely to occur.
The time of the original earthquake can be displayed on one of the charts. And when EM Signals suggest that a significant aftershock might be about to occur in the same location as the original earthquake, its time and the EM Signal times can be displayed on the charts. If they are similar looking then that can provide some data to support the expectation that a powerful aftershock could be about to occur at that location.
On the Wave Chart Web page there are a number of examples that show how that happened with past earthquakes.
There are presently two versions of the Wave Chart program available. The original version having probably the clearer data display is an Excel spreadsheet program. A newer version was created using the TrueBasic computer programming language. The next version of the downloadable Etdprog.zip file will probably contain one or both of those programs. The TrueBasic program was at one time available for downloads. But the original Excel program could not be made available for downloads in the past because of its large size. None of my earlier Web sites had enough bandwidth or download capacity for the program.
Return
To HRPROJ Homepage
This first version of this Web page was
stored at this site on
June 7, 2010. Comments regarding this Web site are
welcome.
Please send them to: seismic@ix.netcom.com The information on
this Web
page represents expressions of personal opinion by
the Web page author. The
address -URL- for this Web page is:
http://www.hrproj.com/Etdprog-Interpret.html